
Kategori : ENERGY AGENDA NEWS, COAL NEWS - Tarih : 04 January 2019
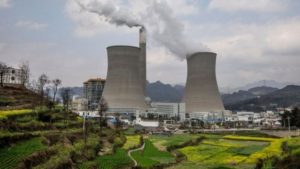
Since 2000, the world has doubled its coal-fired power capacity to 2,000 gigawatts (GW) after explosive growth in China and India. Another 200GW is being built and 450GW is planned. More recently, 200GW has closed due to a wave of retirements across the EU and US. Another 170GW is set to retire by 2030 and 13 of the world’s 77 coal-powered countries plan a total phaseout.
Meanwhile, electricity generated from coal peaked in 2014, so the expanding fleet is running fewer hours than ever. This erodes coal’s bottom line, as does competition from gas and renewables.
 The way coal’s next chapter unfolds is key to tackling climate change. All unabated coal must close within a few decades if warming is to be limited to less than 2C above pre-industrial temperatures, according to the International Energy Agency (IEA).
To shed light on this story, Carbon Brief has mapped the past, present and future of all the world’s coal-fired power stations. The interactive timeline map, above, shows the plants operating in each year between 2000 and 2017, as well as the location of planned new capacity.
Using data from CoalSwarm’s Global Coal Plant Tracker, it features around 10,000 retired, operating and planned coal units, totalling nearly 3,000 gigawatts (GW) across 95 countries.
How to read the timeline map
The timeline map above shows a circle for each coal plant in the world, proportional to the generating capacity in megawatts (MW). Each plant may be made up of multiple units – the individual boilers and steam turbines. The notes at the end of this article explain how the data was processed.
The graphic, below, explains how to use the map features. Select the year, region and base map – including a satellite view – using the information box on the left.
Zoom, rotate and tilt the map using the navigation tools in the top right corner and your mouse scroll wheel. Use the search box to find locations by city, region, postal or zip code. The home button will reset the map to its original state.
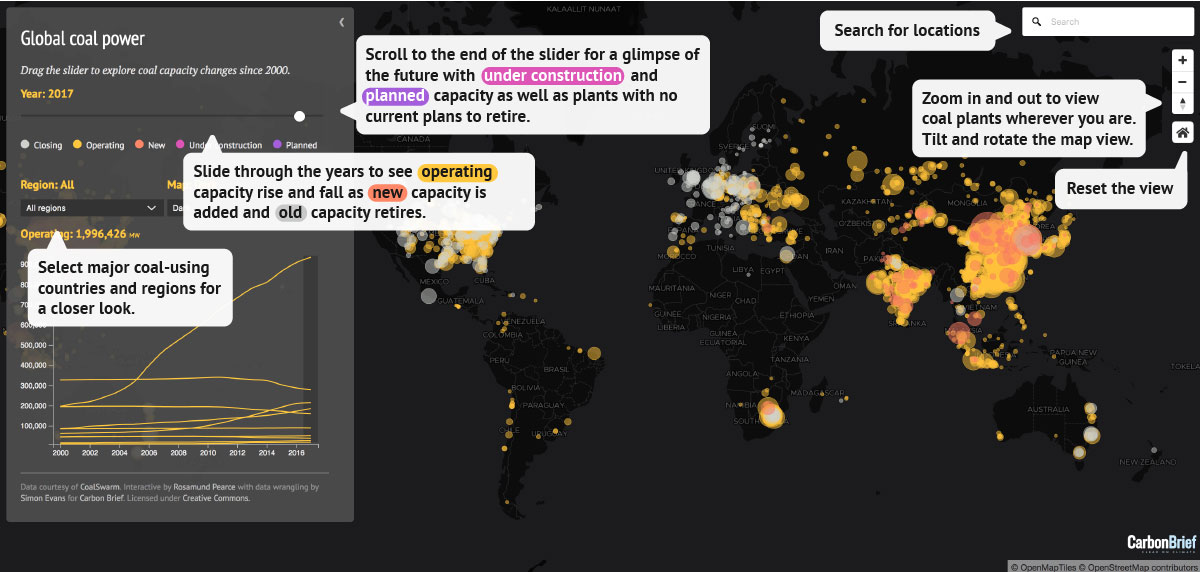
Coal plants on the map are colour-coded according to whether they are operating (yellow), new or expanded that year (red) and closing or shrinking the following year (white).
Drag the timeline slider from 2000 through to 2017 to see where and when coal plants are added and retired. For 2017, plants are coloured white if they are expected to close some or all of their units.
The rightmost end of the slider (“Future”) shows plants that have no known plans to retire (yellow), those currently being built (pink) and those in various stages of planning (purple).
Note that since 2010, only 34% of planned capacity has been built or started construction (873GW), whereas 1,700GW has been cancelled or shelved, according to CoalSwarm. For example, a tender to build one new plant may attract several bids, all of which would be counted towards the “planned” total.
The map shows coal capacity, whereas electricity generation and CO2 emissions depend on a range of other factors. Most important is how often coal plants run – their load factor. Global average loads started falling in 2007 and coal power CO2 peaked in 2014. More on this below.
Finally, note that the map design is responsive and has fewer features on smaller mobile devices. The map uses WebGL and will not work on some older browsers. The map may also fail to load if you are using an ad-blocking browser plugin; try whitelisting the Carbon Brief website.
Rising coal capacity
Global coal capacity grew in every year between 2000 and 2017, nearly doubling from 1,063GW to 1,995GW. As far back as 1950, coal capacity has only ever risen – though this older data is less reliable.
The promise of cheap electricity to fuel economic growth is driving this expansion. Coal generates 40-41% of the world’s electricity, its highest share in decades. And there are now 77 countries using coal power, up from 65 in 2000. Another 13 plan to join the club.
CO2 emissions from existing plants are enough to breach the carbon budget for 1.5 or 2C. These limits would mean no new coal plants and closing 20% of the fleet early, according to one recent study.
All unabated coal would have to close by 2040 to stay “well below” 2C, according to the International Energy Agency (IEA). This would mean closing 100GW of coal capacity every year for 20 years, or roughly one coal unit every day until 2040. (Some pathwayshave slightly slower phaseouts.)
Yet newspaper headlines and energy projections suggest coal growth will not stop.
This bleak outlook for the climate is tempered by signs of rapid change. The pipeline of plants under construction (pink) or proposed (purple) has halved since 2015, as the chart below shows. Retirements (grey) are also accelerating, reaching a cumulative 197GW between 2010 and 2017.


